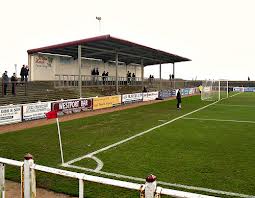
 Last season's average - 684 was slightly above our average for the past 10 seasons (644) for league games. Down only 120 from the previous highscoring season when we were in contention for the title
A third ranking in the Table shows we deserve to be in this division. A solid fanbase
Average Attendances Division 2 - 2012-13
|
Games |
Total |
Highest |
Average |
||
|
1 |
|
18 |
29,856 |
2,568 |
1,659 |
|
2 |
Ayr United (7) |
18 |
18,119 |
1,373 |
1,007 |
|
3 |
Arbroath (5) |
18 |
12314 |
940 |
684 |
|
4 |
Alloa Athletic (2) |
18 |
9914 |
1,224 |
551 |
|
5 |
Brechin City (3) |
18 |
9881 |
978 |
549 |
|
6 |
Stenhousemuir (6) |
18 |
9778 |
818 |
543 |
|
7 |
Forfar Athletic (4) |
18 |
9704 |
903 |
539 |
|
8 |
East Fife (9) |
18 |
9462 |
753 |
526 |
|
9 |
Stranraer (8) |
18 |
7818 |
1,015 |
434 |
|
10 |
Albion Rovers (10) |
18 |
6967 |
853 |
38Division 2 Attendance 2012-13 |
Lichties Home Attendances - Previous 10 years - Average 644
2011-12: 803
2010-11: 588
2009-10: 522
2008-09: 638
2007-08: 612
2006-07: 730
2005-06: 591
2004-05: 575
2003-04: 625
2002-03: 759
Total: 6443